The LanDS is a science-based Land degradation Decision-Support Toolbox targeted to support REACT4MED participants (partners, stakeholders, and policy makers), by providing a safe and effective georeferenced repository to store, share and reuse data collected by the pilot areas, and by implementing indicators to assess land restoration measures impacts across different geographic areas. Combining existing knowledge from public repositories and expertise coming from the pilot areas, the LanDS elaborates machine-learning (ML)-based procedures to identify critical areas in the Mediterranean, where to focus up or out-scaling of restoration measures, exploring future climate and socio-economic scenarios. Finally, the LanDS web dashboard, specifically addressed to decision makers, is in development to effectively share project's outcomes and support assessment and policy recommendation activities.
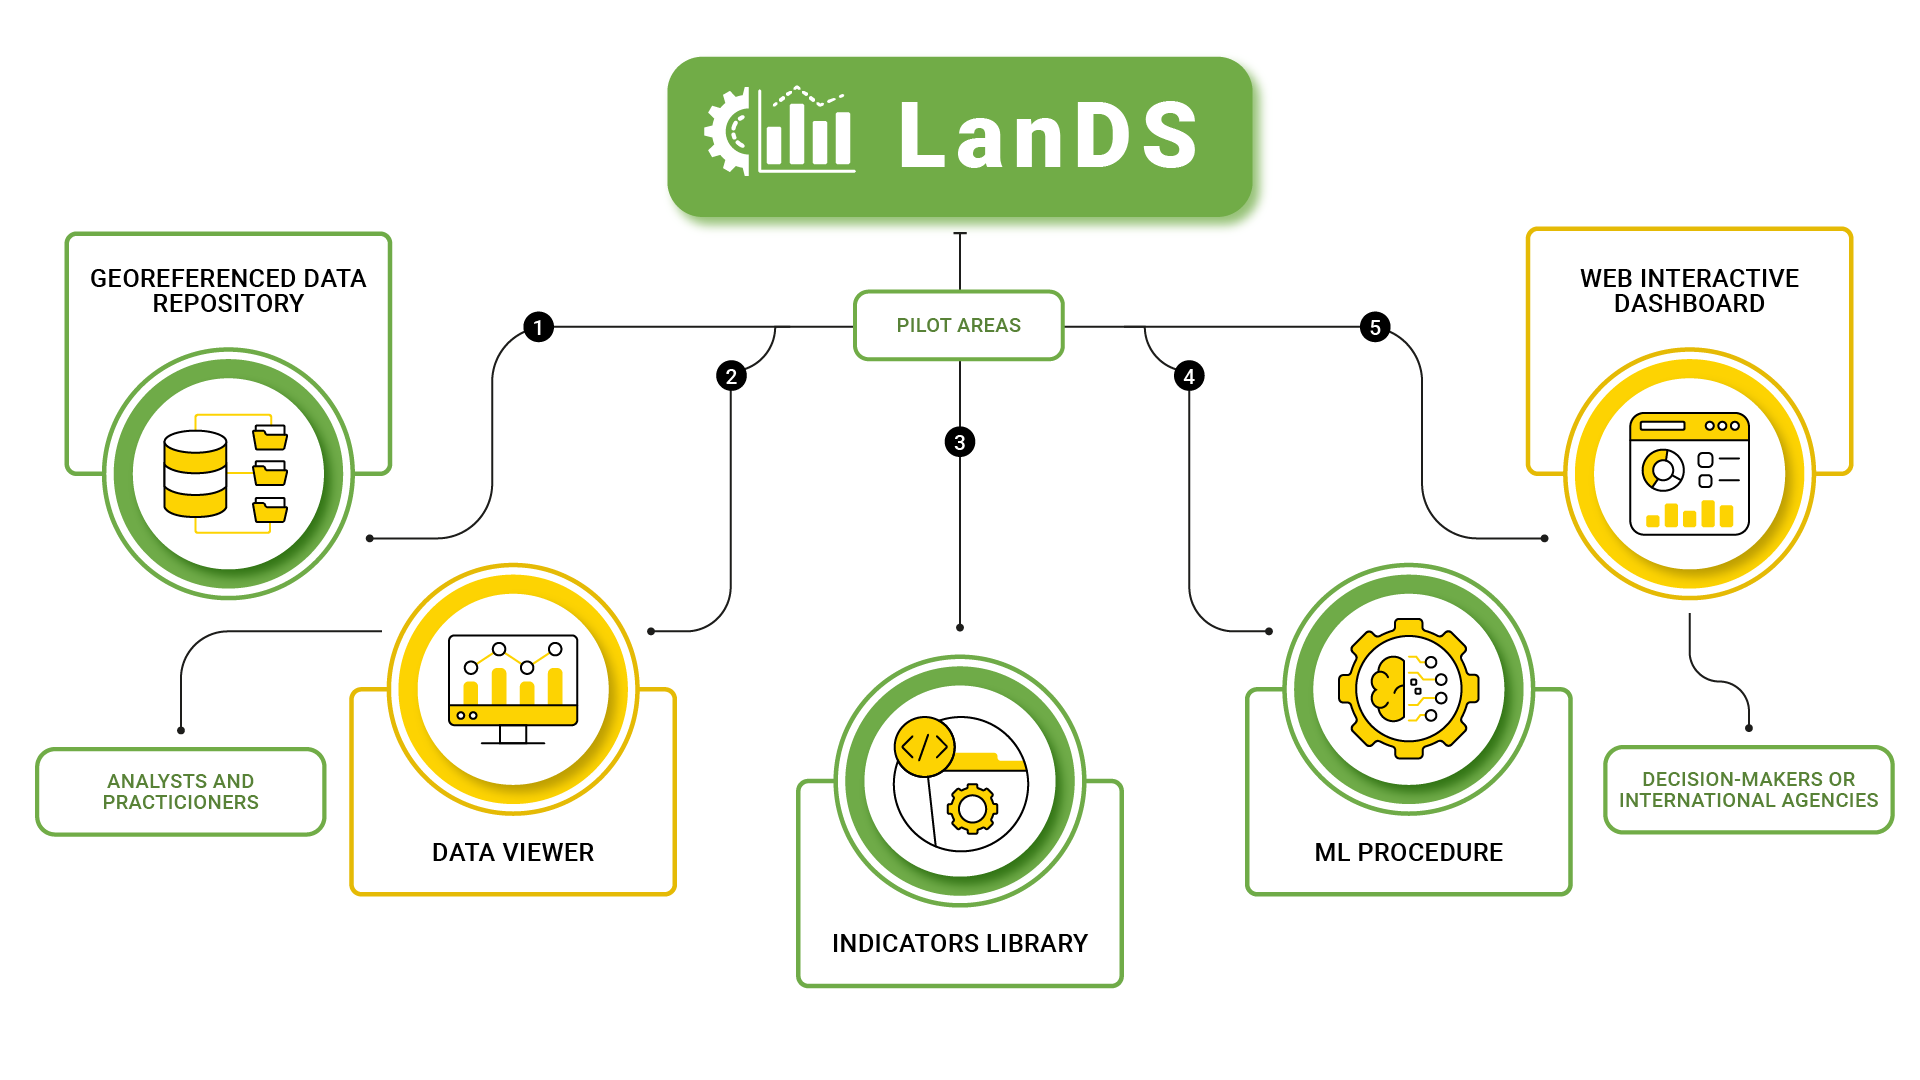
The LanDS is then composed of five different tools: 1) a geo-referenced data repository serving as a knowledge base by collecting site-specific data and resources from the pilot areas as well as from global or regional public repositories for the Mediterranean area; (2) a data viewer, containing a set of visual analytics tools linked with this repository allowing the effective sharing and access to data, and their interactive exploration; (3) an indicators library implemented as a modular and generalised code library applicable to different geographical contexts based on collected data and indicators identified; (4) a ML tool to identify potentially suitable areas in the Mediterranean for up- and outscaling of restoration measures; (5) a web interactive dashboard, providing a harmonised land degradation assessment and evaluation of impacts of restoration measures, as well as a user-friendly interface.
This online documentation servers as a user's guide to navigate the toolbox and getting started with its functionalities.
Before exploring the tools in more detail, please find the link to the submitted deliverables explaining the development process of the toolbox and correspondent functionalities:
- D4.1 LanDS requirements and specifications: Report summarising the outcomes of ERLL stakeholders' involvement process and defining features and requirements of the LanDS toolbox.
- D4.2 LanDS toolbox prototype: Prototype of LanDS toolbox, including first versions of the geo-referenced data repository, the visualization tools and the indicators library, ready to be shared with partners and stakeholders for testing and feedback gathering.
- D4.3 Final LanDS toolbox: Release of the final version of the LanDS toolbox, including the planned tools, populated with project data and documented by a user-guide with examples and tutorials. The software developed will be released in an online public repository.
- D4.4 LanDS Dashboard: Release of the LanDS dashboard, populated with outcomes of LanDS machine learning based tool, for land restoration area identification. The dashboard will be accessible through a web interface and published on the project website.
(1) The georeferenced data repository can be access from the LanDS landing page and/or from the top bar menu, selecting:
- Map (LanDS landing page), which shows the map of the Mediterranean Basin with nine location pins to highlight the nine available data collections (including the 8 pilot areas in Cyprus, Greece, Italy, Spain, Morocco, Israel, Turkey, and Egypt, plus a general one for the Mediterranean Area) and, on the right-hand side, a column with the collections represented by their reference image, their title/location, and associated tag (issues and/or restoration action), which can be easily scrolled down and selected as needed: the user has the option to select the collection i from the pins on the map or from the reference images;
- Collections, displaying the 9 collections as described in the previous point;
- Data Browser, a dynamic table where datasets (resources and indicators) are grouped by collection and linked to their descriptive page (by clicking on the dataset name) and to the related dataset (by clicking on file’s link). Other available functionalities are listed below:
- Show (on the top-left side of the page): it displays the selected number of available entries;
- Search (on the top-right side of the page): it provides a quick filter on displayed rows based on text included in each field;
- Advanced Search (next to Search): performs a more refined spatio-temporal query across all the collections.
Check out this quick overview to first navigate the LanDS from the landing page to the repository and datasets.
Full open access, data visualization and download is granted to anyone visiting the LanDS website, while the possibility to upload and edit data is given only to logged in users (here is how to quickly login, if your account is activated by the admin).
(2) The Data Viewer provides quick and effective visualizations of the different datasets uploaded in the repository and can be accessed from:
- from the dataset/item page, to contextually show the visualizations available for the specific dataset;
- from the top menu bar, to directly open the Data Viewer page.
The following file formats are supported by the LanDS and provide an automatic visualization:
| Dataset type | File formats supported by LanDS | Available chart visualisations on LanDS | Map Visualisations |
| Tabular data | .xlsx .csv | Line Monitoring charts | Heatmap |
| Geographical data | .shp (in .zip) .gpkg .kml / .kmz WKT .csv/.txt .tiff / .asc | N/A | Simple/Geo Map Choroplet Map Tif map with slider to navigate different bands (e.g., different time step) |
| Distributed Time series | .nc | Time series line plot for spatially averaged data, with range of reference values Box plot and decade boxplot for decades period | Raster map with time slider to navigate different time step |
A monitoring data template is available to store data from the pilot areas with the aim of assessing the effectiveness of the implemented restoration action, with the possibility of adding the measured parameters, the type of experiment/action, and the different sites.
A monitoring data example (provisional) is uploaded on the LanDS to further support the user. Check out how to upload your monitoring data file and visualize it in the monitoring charts visualization type. In this case, the dataset is uploaded to the Italian pilot area (Stornara and Tara) and the restoration action is organic farming (which is compared to traditional farming in different sampling sites).
The monitoring data file with real measurements is already uploaded and available for the Italian pilot area and can be visualized at this link. The correspondent sampling points are also uploaded as a GeoPackage file (.gpkg) and can be visualized as geo map as shown in this screencast, including information on latitude, longitude, type of restoration action, and soil depth.
Geospatial vector data can be also uploaded as Shape files (.shp) as shown in this example, with the attention to upload the zipped folder (.zip) containing the .shp, .shx, .dbf, .cpg files.
The user has the possibility to edit the dataset to change the description, the proper visualization type, the temporal frame, the spatial extent of the bounding box, if the item is an indicator or a resource, and the metadata, if needed. Check out at this link how to edit a dataset, e.g., for the monitoring data example, and how to visualize it in the data viewer.
Further, satellite-based indices have been computed by the team of UH (project's partners) and are available on the LanDS for different pilot areas. Satellite-based indicators can be uploaded as csv files (visualized as line charts), tif images, or NetCDF files. Check out how to upload, visualize, and edit a tif file, with slider to navigate the different bands.
(3) The code Library of Indicators can be accessed from the top bar menu, from which the user will land on a documentation page containing main information. The code library is structured as a Jupiter notebook, a web environment where is possible to integrate Python code with rich text description and interactive visualization. The code library is available in a software repository hosted on Gitlab and the code is released under the latest version of the GNU General Public License (GPL).
In total, 56 climate, biophysical and socioeconomic indicators have been computed by the LanDS based on data provided by TUC (project's partners) and are stored in the repository in the Mediterranean area collection. Check out at this link an example of a climate extreme index (sources: Climdex; IPCC 6th assessment report), which is stored as a NetCDF file (.nc) and can be visualized as a line chart, a boxplot, and a map with time slider.
In this other screencast, the biophysical and socioeconomic changes computed by TUC can be visualized in a heatmap for a baseline and extreme future scenarios (respectively, SSP245 and SSP585).
(4) The ML tool can be accessed from the top bar menu, from which the user will land on a documentation page, briefly introducing the procedure (methods, inputs and outputs). The software code has been released on the LanDS Gitlab repository.
(5) The LanDS web interactive dashboard is currently under development development and will be accessible from the top bar menu (expected around the beginning of April 2025). The dashboard is divided into three main pages, indicating respectively (1) the environmental threats in the Mediterranean and REACT4MED pilot areas, (2) one representative ML tool outcome of the clustering analysis, showcasing similar areas in the Mediterranean on the basis of a large set of biophysical, climate, and socioeconomic indicators (at around 12 km resolution), and (3) outscaling maps based on the expert-based filters driven by the different restoration actions implemented in the 8 project's sites at higher resolution (from 1 km down to 250 m).
-- Last update on 31 March 2025 --